FREEZE: Climate Data Explorer

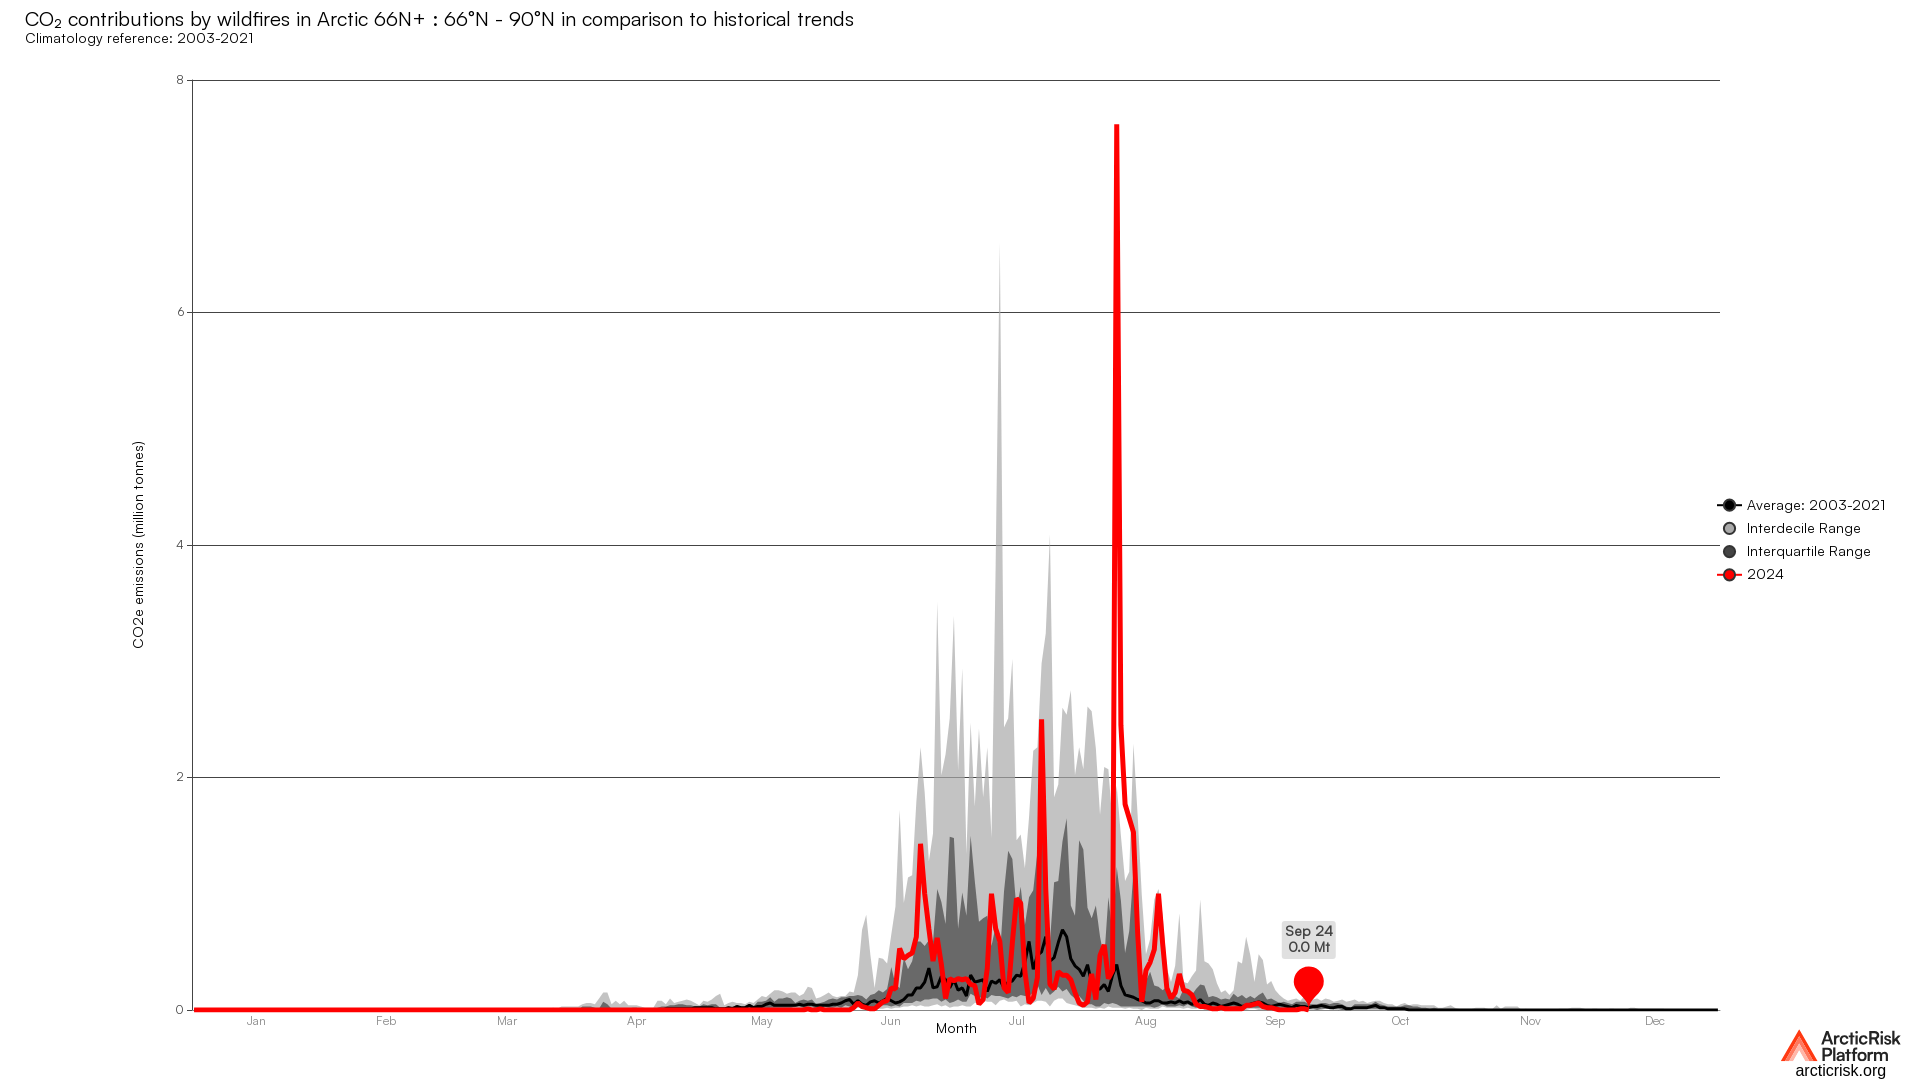
CO2 equivalent emissions in thousand tonnes caused by wild fires in different latitudnal regions . Dataset is based on Copernic…


CO2 equivalent emissions in thousand tonnes caused by wild fires in different latitudnal regions . Dataset is based on Copernic…


CO2 equivalent emissions in thousand tonnes caused by wild fires in different latitudnal regions . Dataset is based on Copernic…


CO2 equivalent emissions in thousand tonnes caused by wild fires in different latitudnal regions . Dataset is based on Copernic…


Daily PM 2.5 contributions in thousand tonnes over the years for different latitudnal zones.Dataset is based on Copernicus Atmosphere Monit…


Daily PM 2.5 contributions in thousand tonnes over the years for different latitudnal zones.Dataset is based on Copernicus Atmosphere Monit…


Daily PM 2.5 contributions in thousand tonnes over the years for different latitudnal zones.Dataset is based on Copernicus Atmosphere Monit…


Daily PM 2.5 contributions in thousand tonnes over the years for different latitudnal zones.Dataset is based on Copernicus Atmosphere Monit…