FREEZE: Climate Data Explorer


Monthly trends in Atmospheric N2O. Derived from datasource available at NOAA Global Monitoring Laboratory.


Monthly trends in Atmospheric Carbon Dioxide. Derived from datasource available at NOAA Global Monitoring Laboratory.
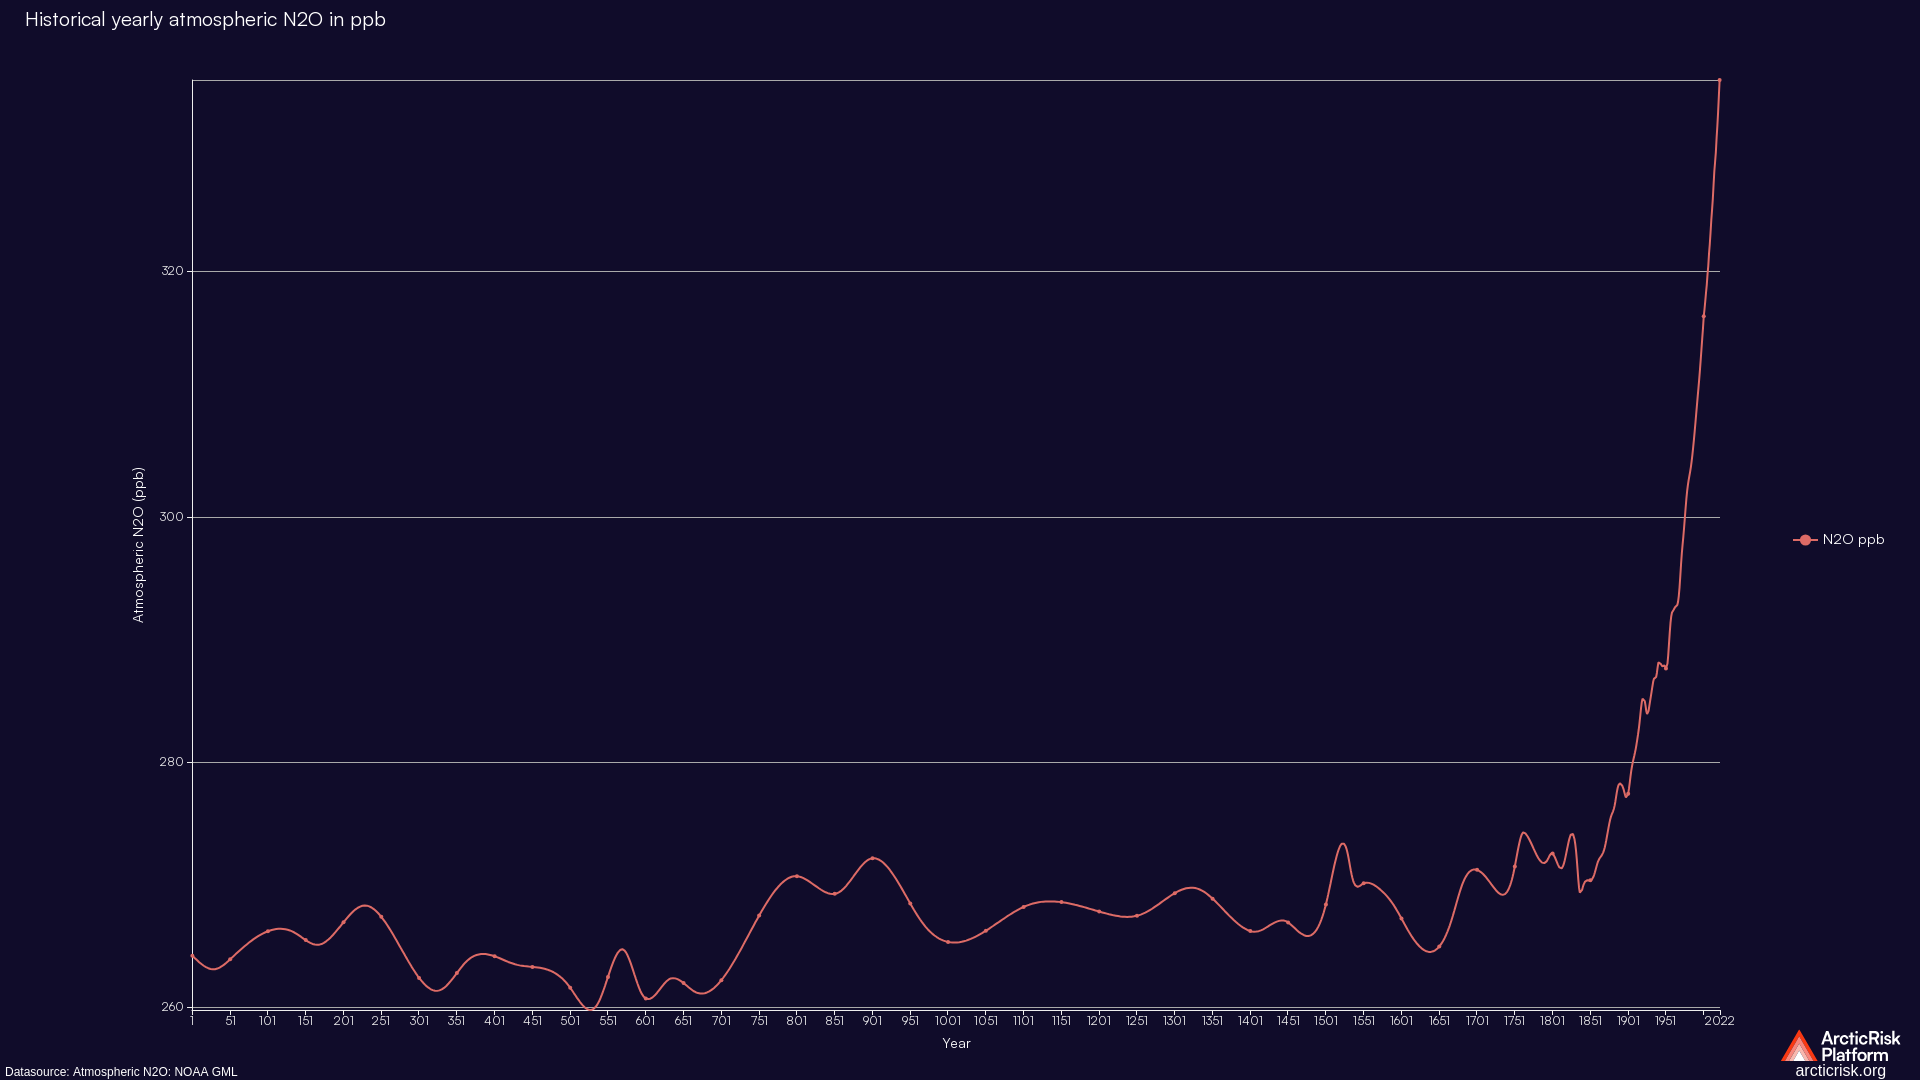

Monthly trends in Atmospheric N2O. Derived from datasource available at NOAA Global Monitoring Laboratory.


Monthly trends in Atmospheric Methane. Derived from datasource available at NOAA Global Monitoring Laboratory.


Yearly trends in Atmospheric CO2 equivalent of greenhouse gases in ppm. Derived from datasource available at NOAA Global Monitoring Laborat…


Monthly trends in Atmospheric Sulfur Hexaflouride. Derived from datasource available at NOAA Global Monitoring Laboratory.


Monthly trends in Atmospheric Carbon Dioxide. Derived from datasource available at NOAA Global Monitoring Laboratory.


Monthly trends in Atmospheric Methane. Derived from datasource available at NOAA Global Monitoring Laboratory.


Monthly trends in Atmospheric Sulfur Hexaflouride. Derived from datasource available at NOAA Global Monitoring Laboratory.


Greenland''s cumulative mass balance and its trend after removing annual seasonality. Derived from MB_SMB_D_BMB.csv file from datasource av…
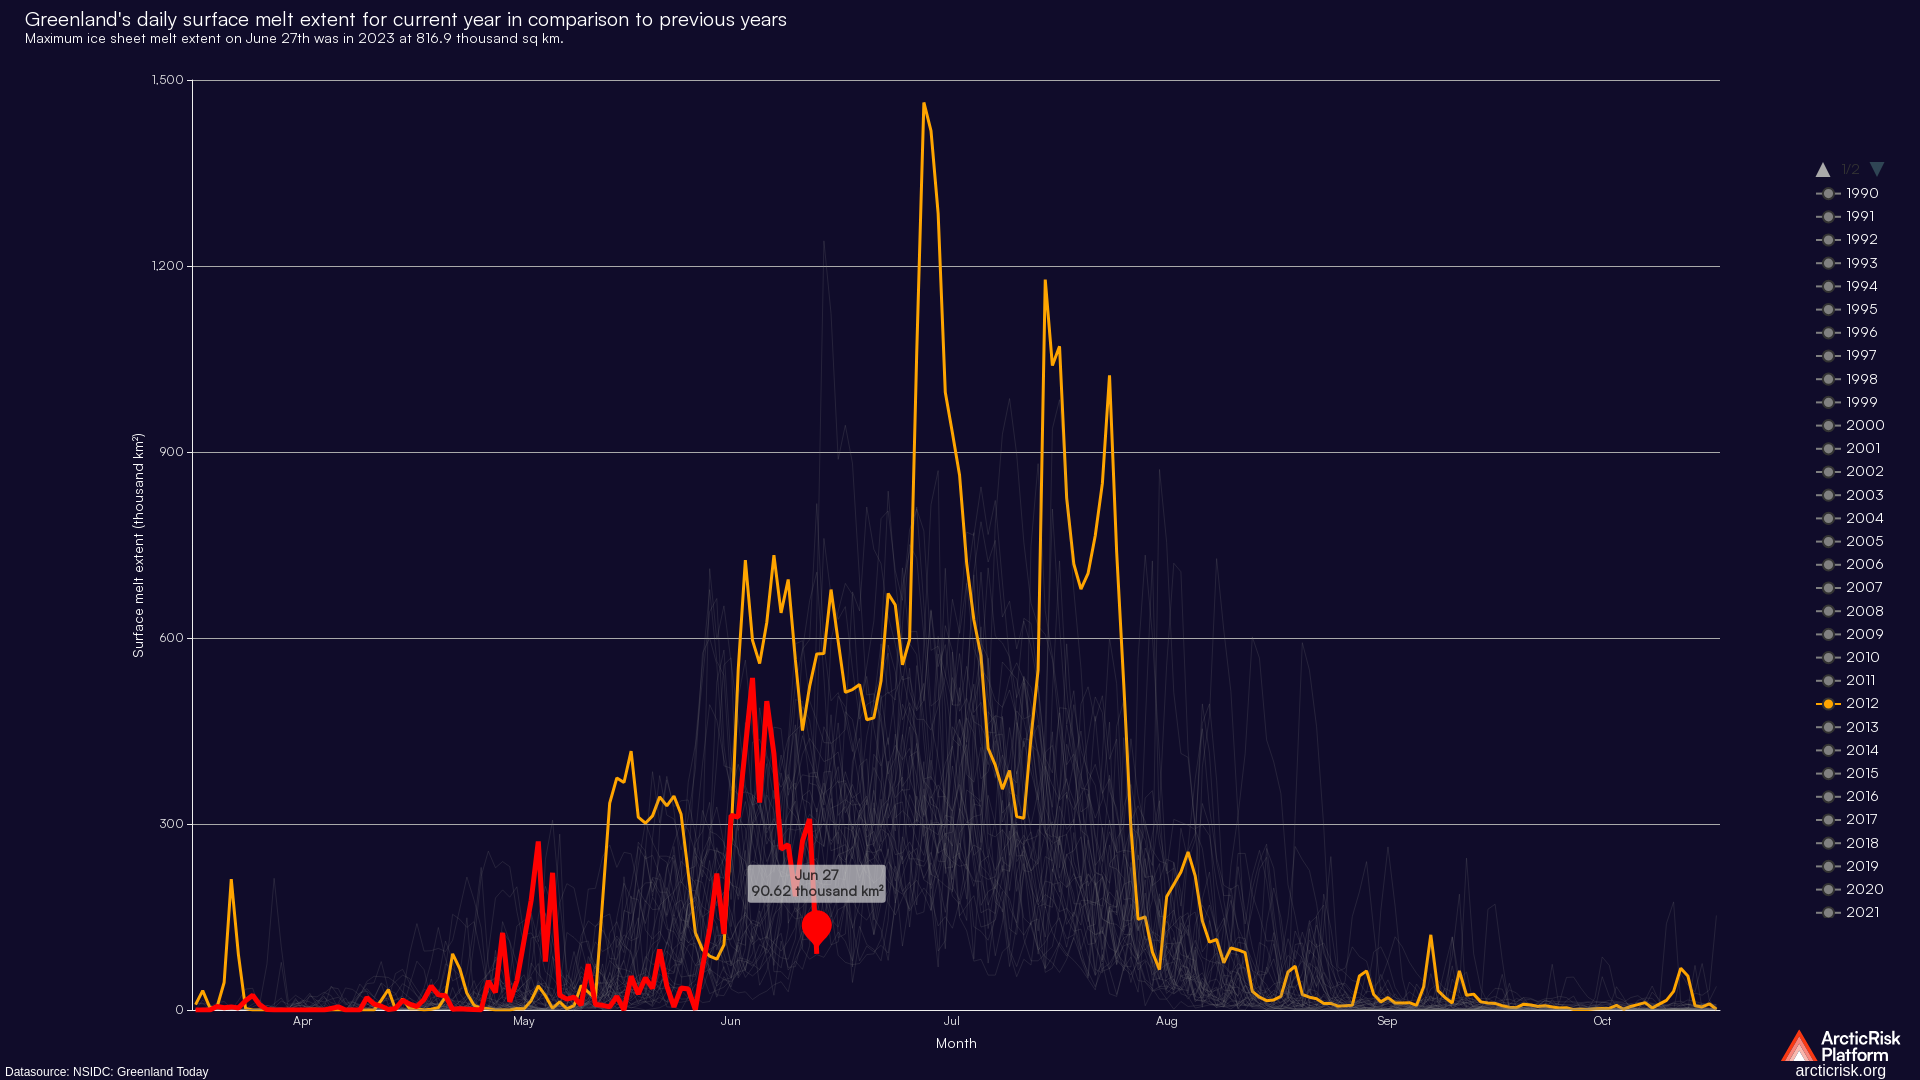
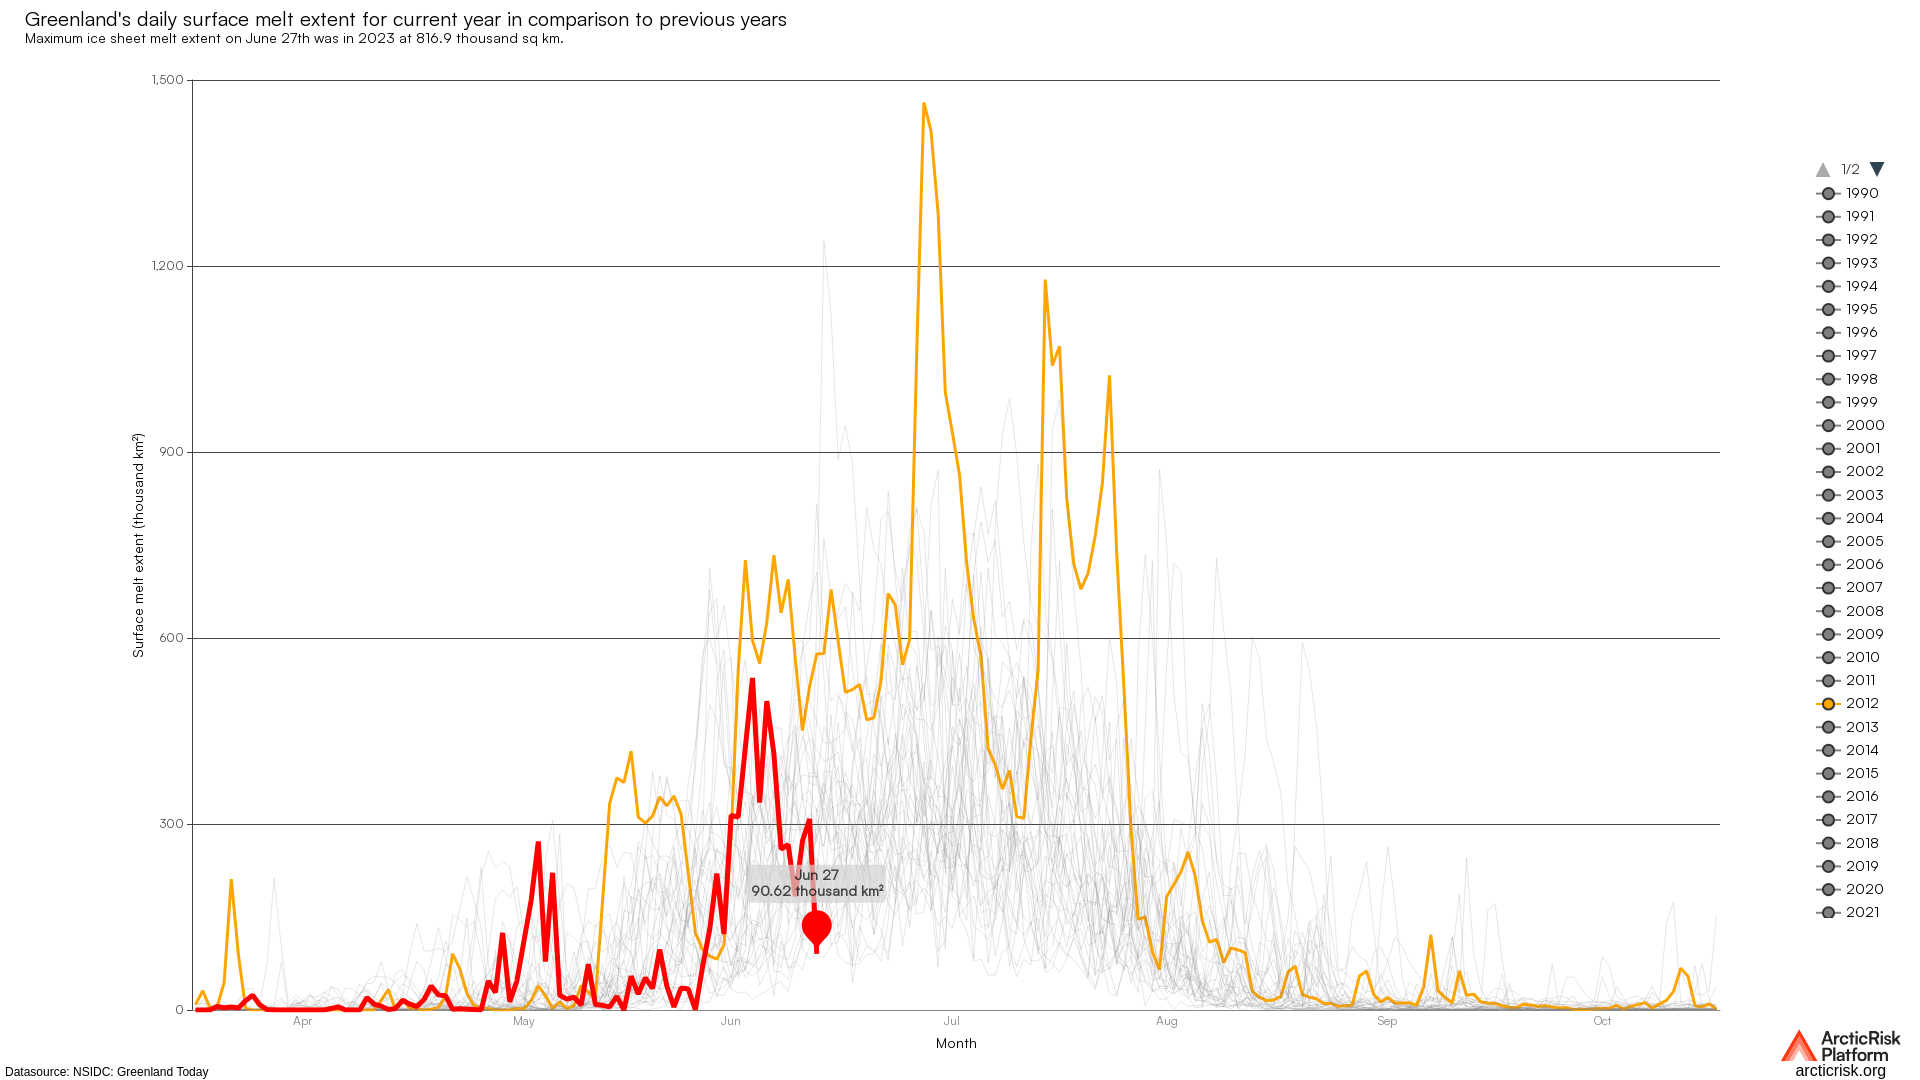
Greenland''s daily surface melt extent data. Derived from datasource available at NSIDC''s Greenland Today Melt Analysis data spreadsheet.


Greenland''s daily surface melt extent data. Derived from datasource available at NSIDC''s Greenland Today Melt Analysis data spreadsheet.