FREEZE: Climate Data Explorer


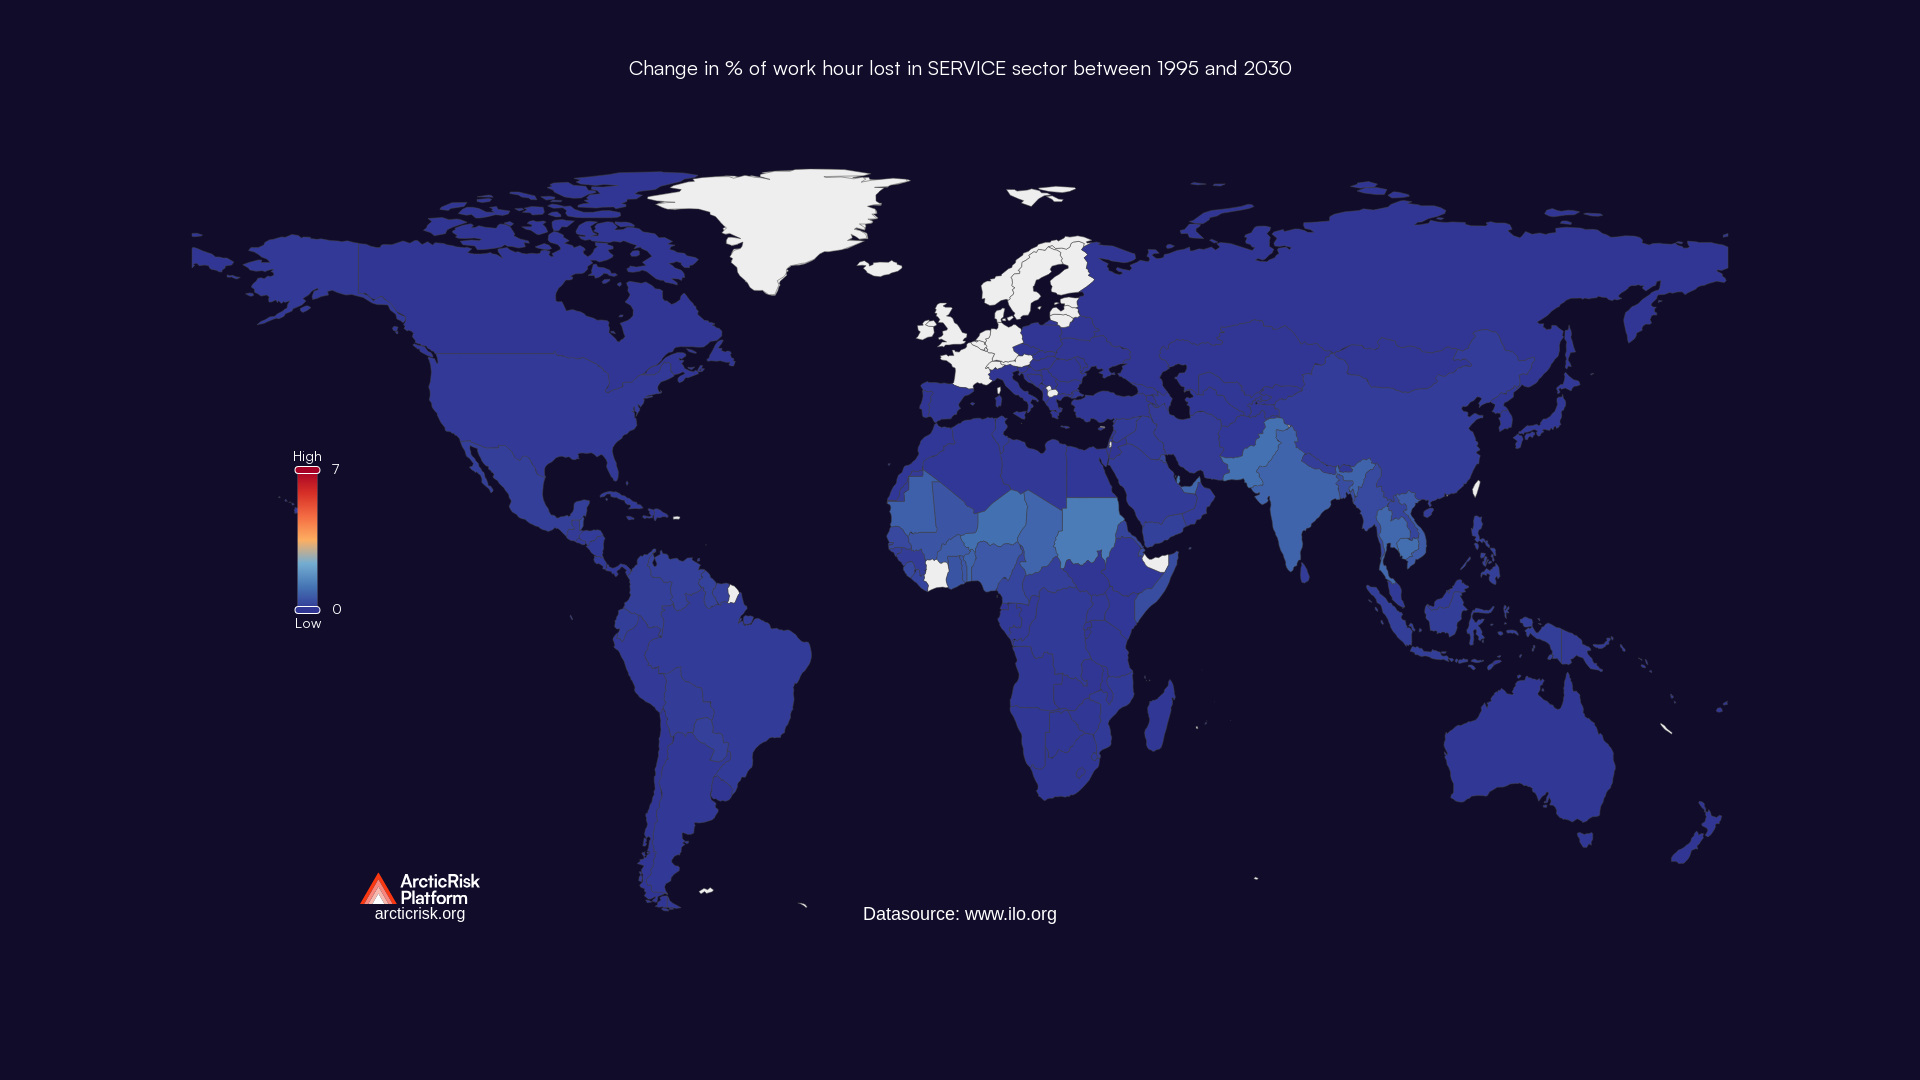
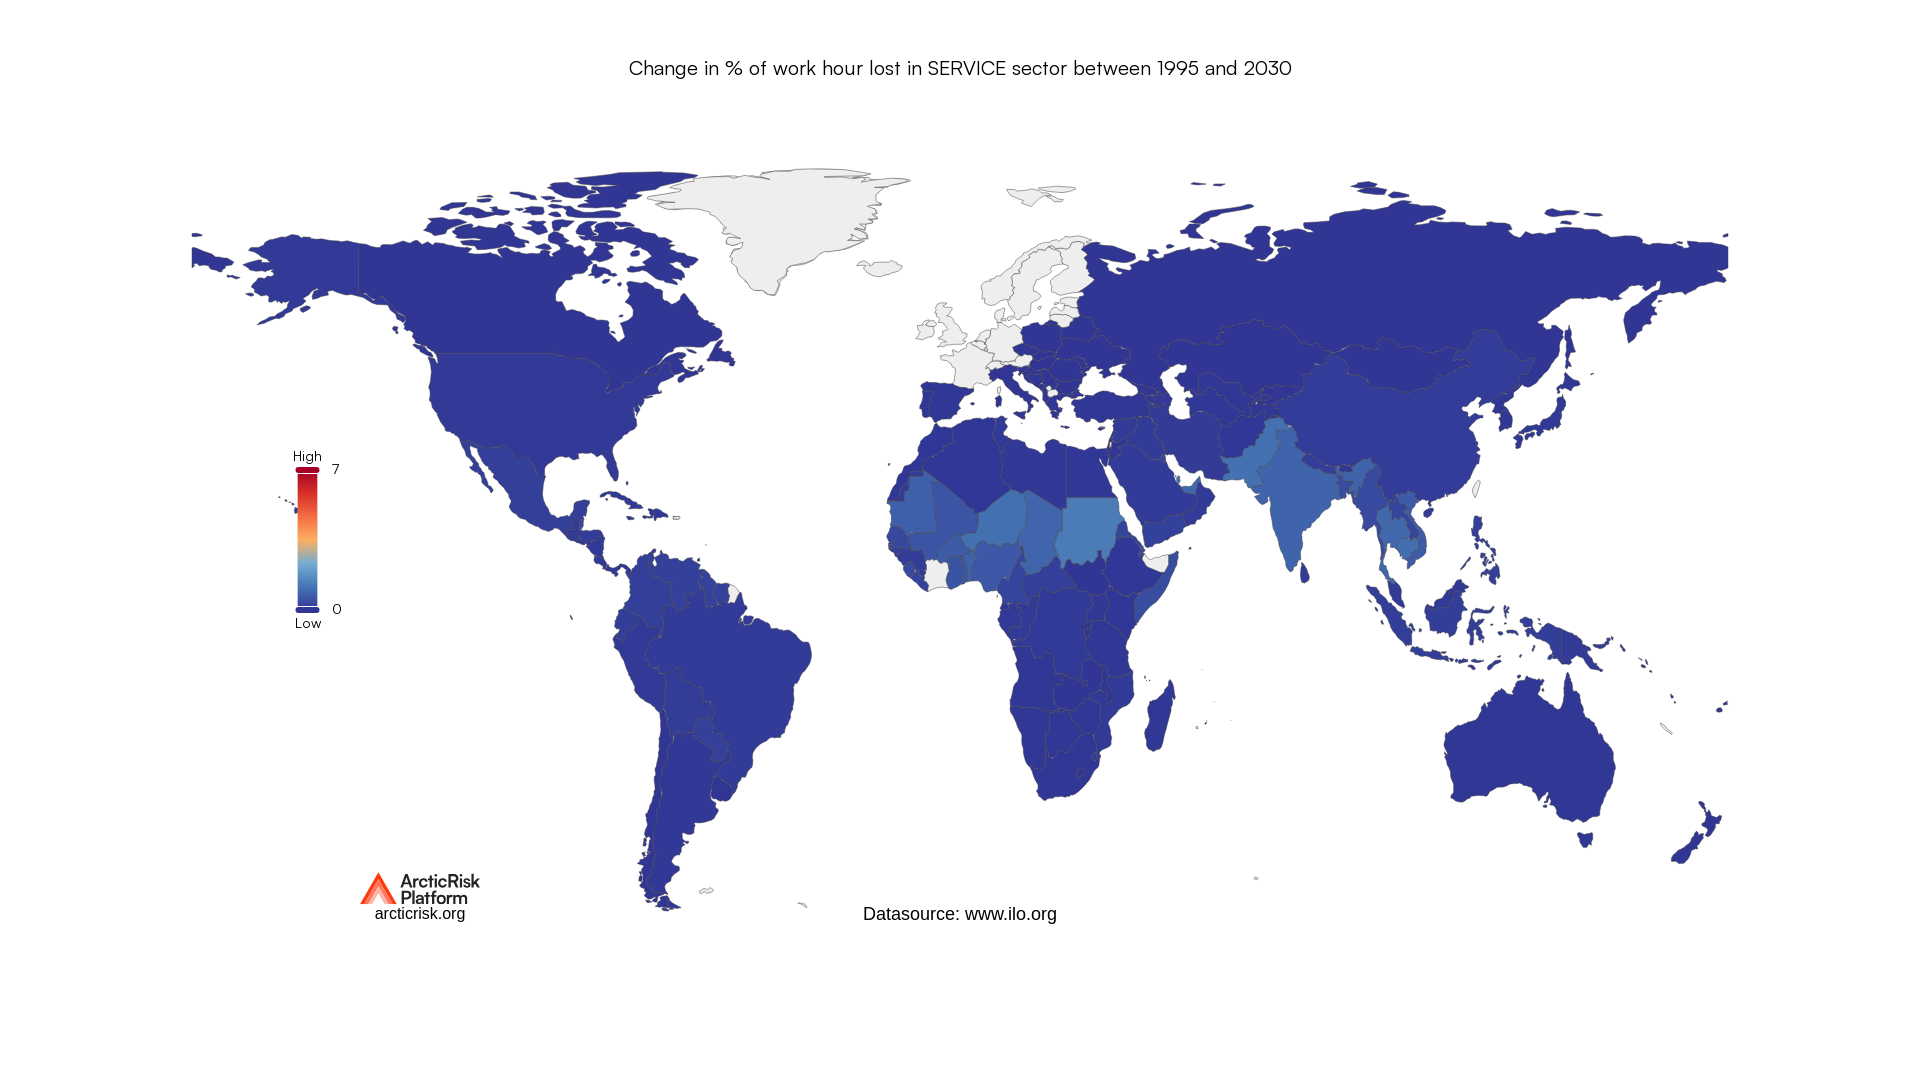
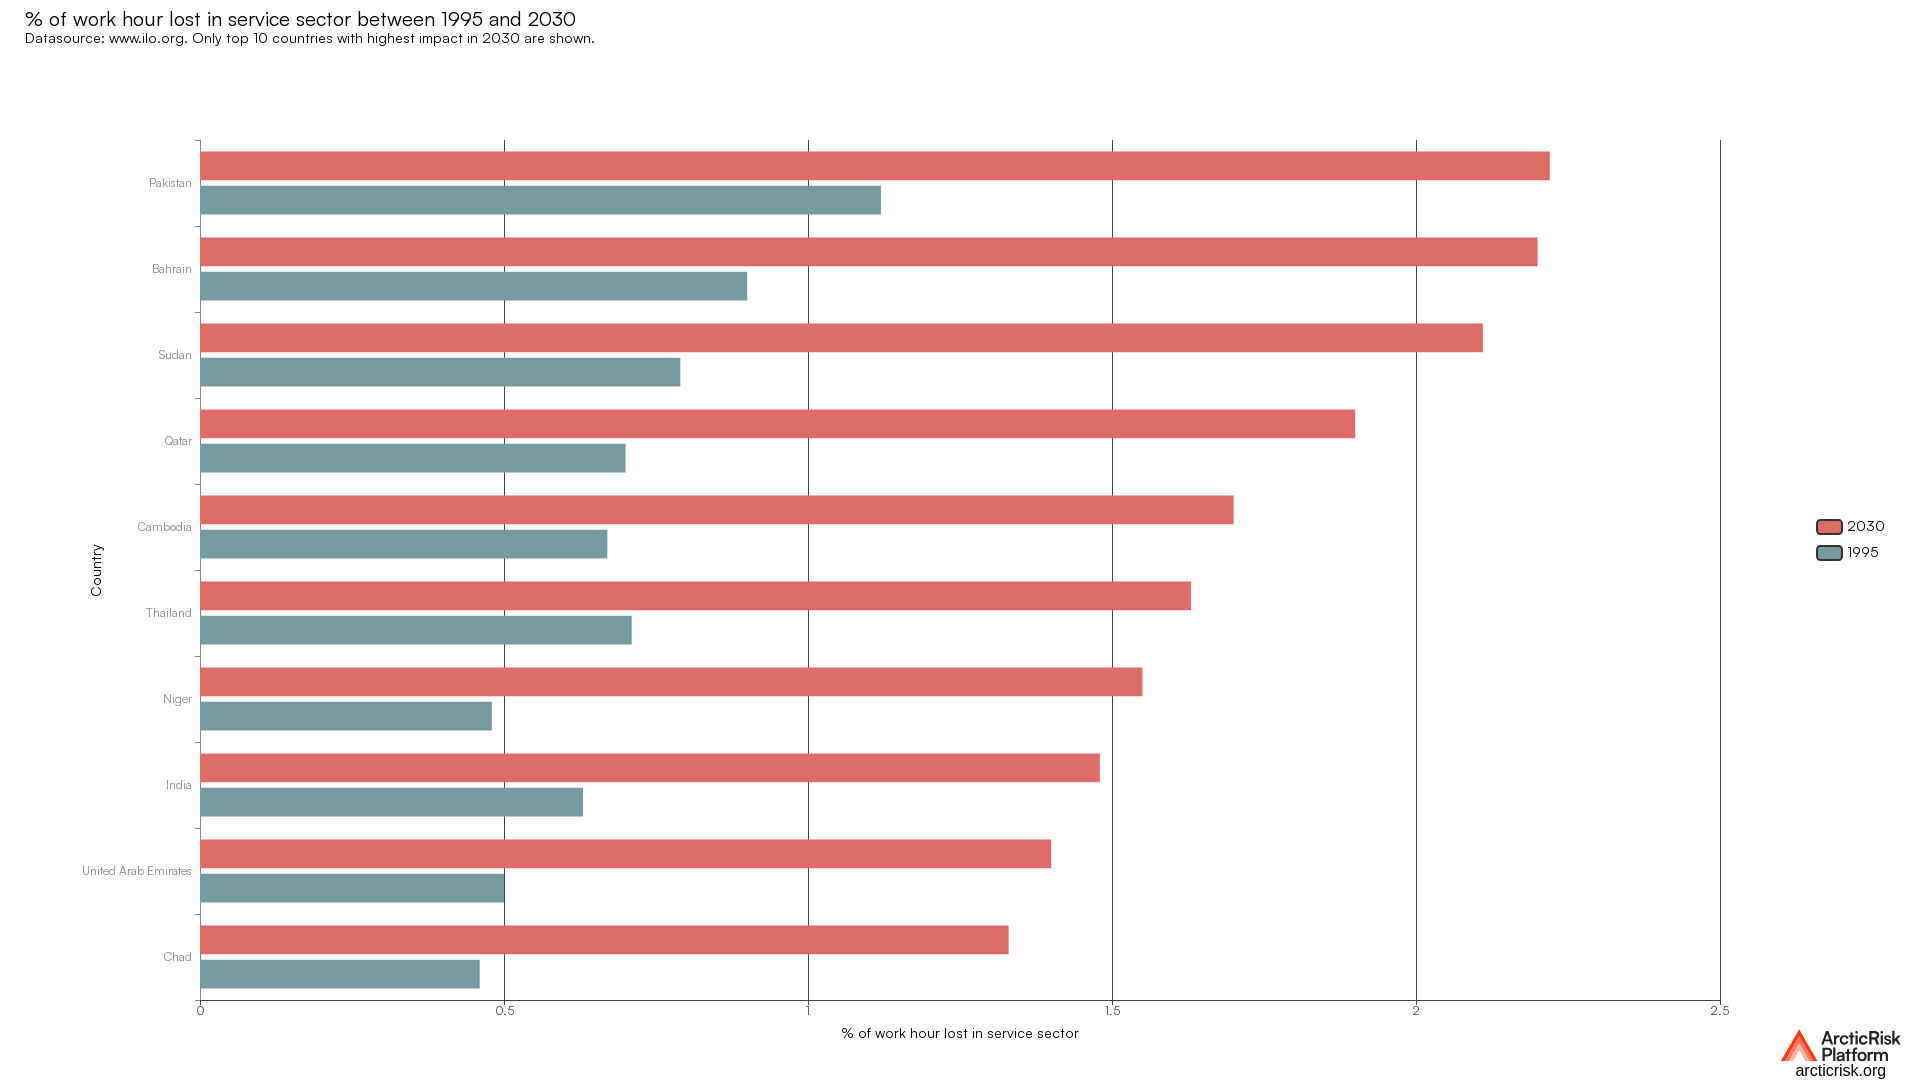
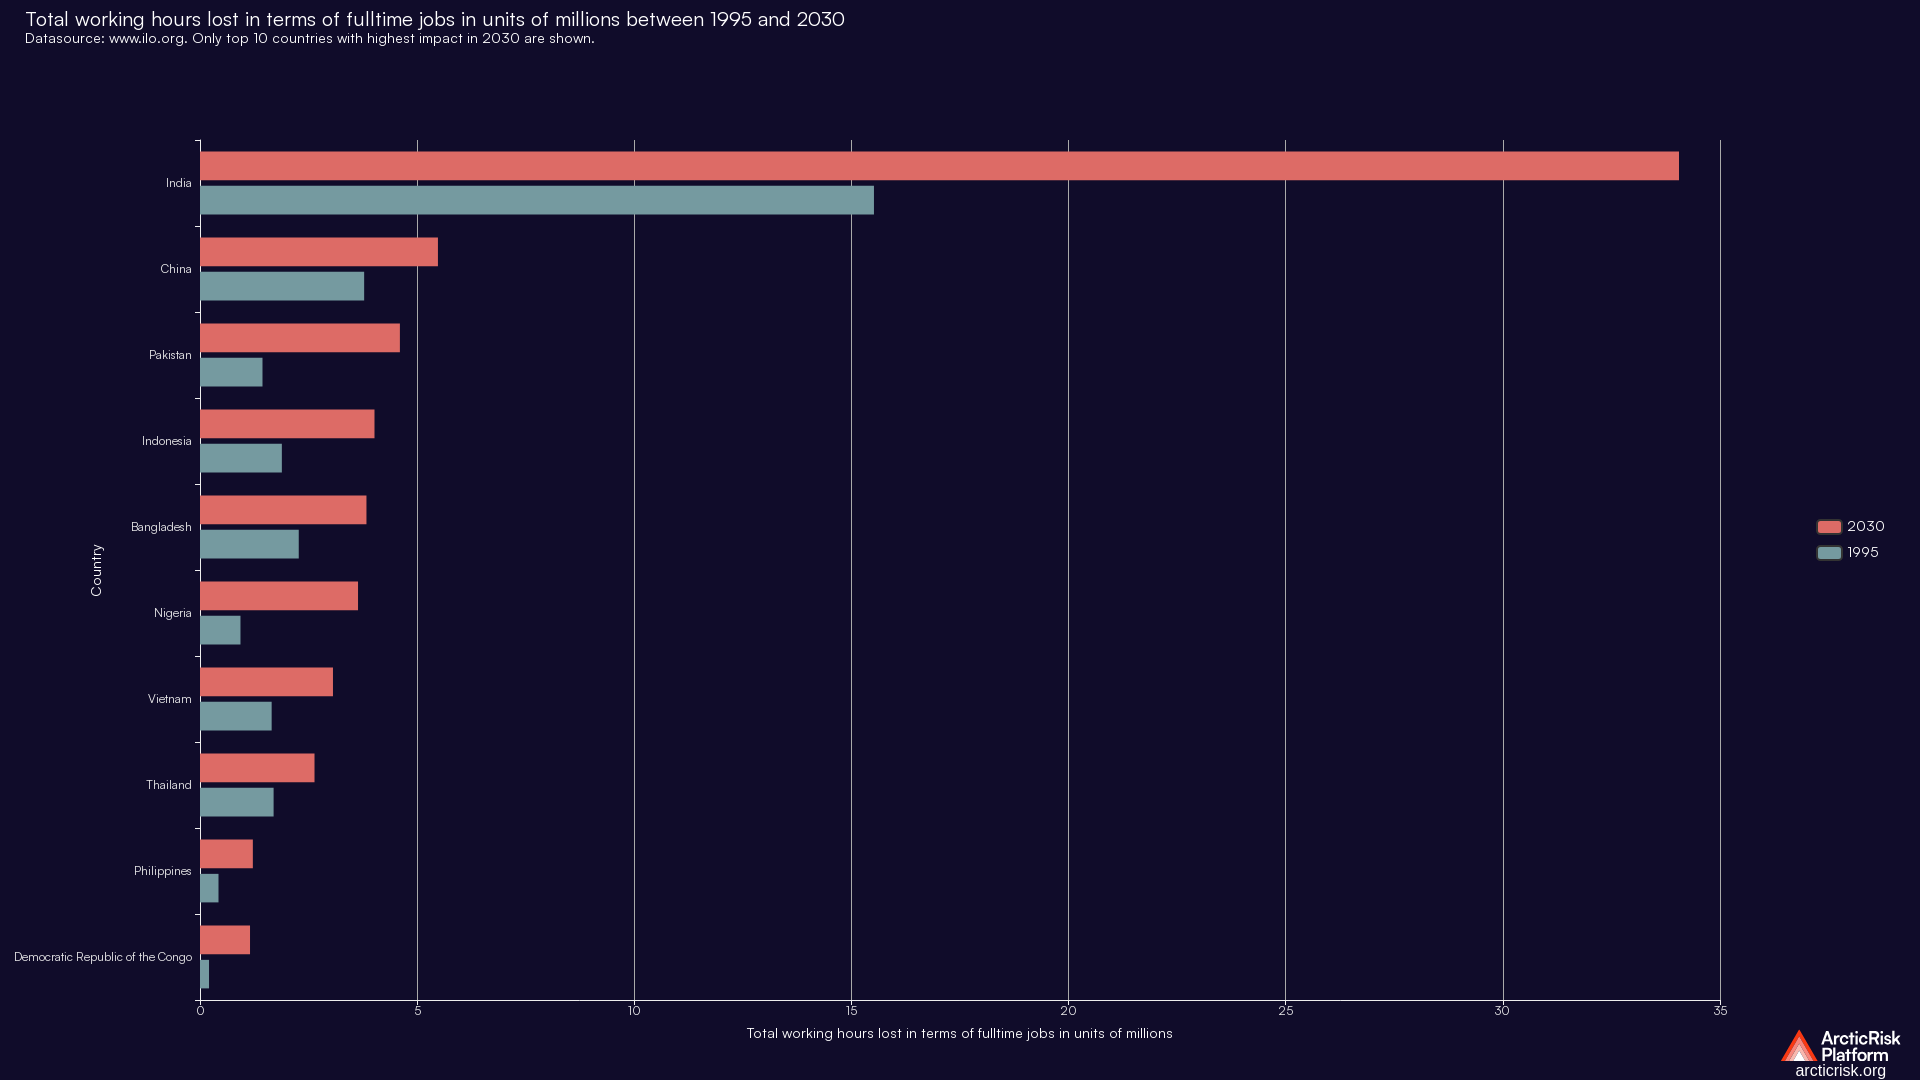
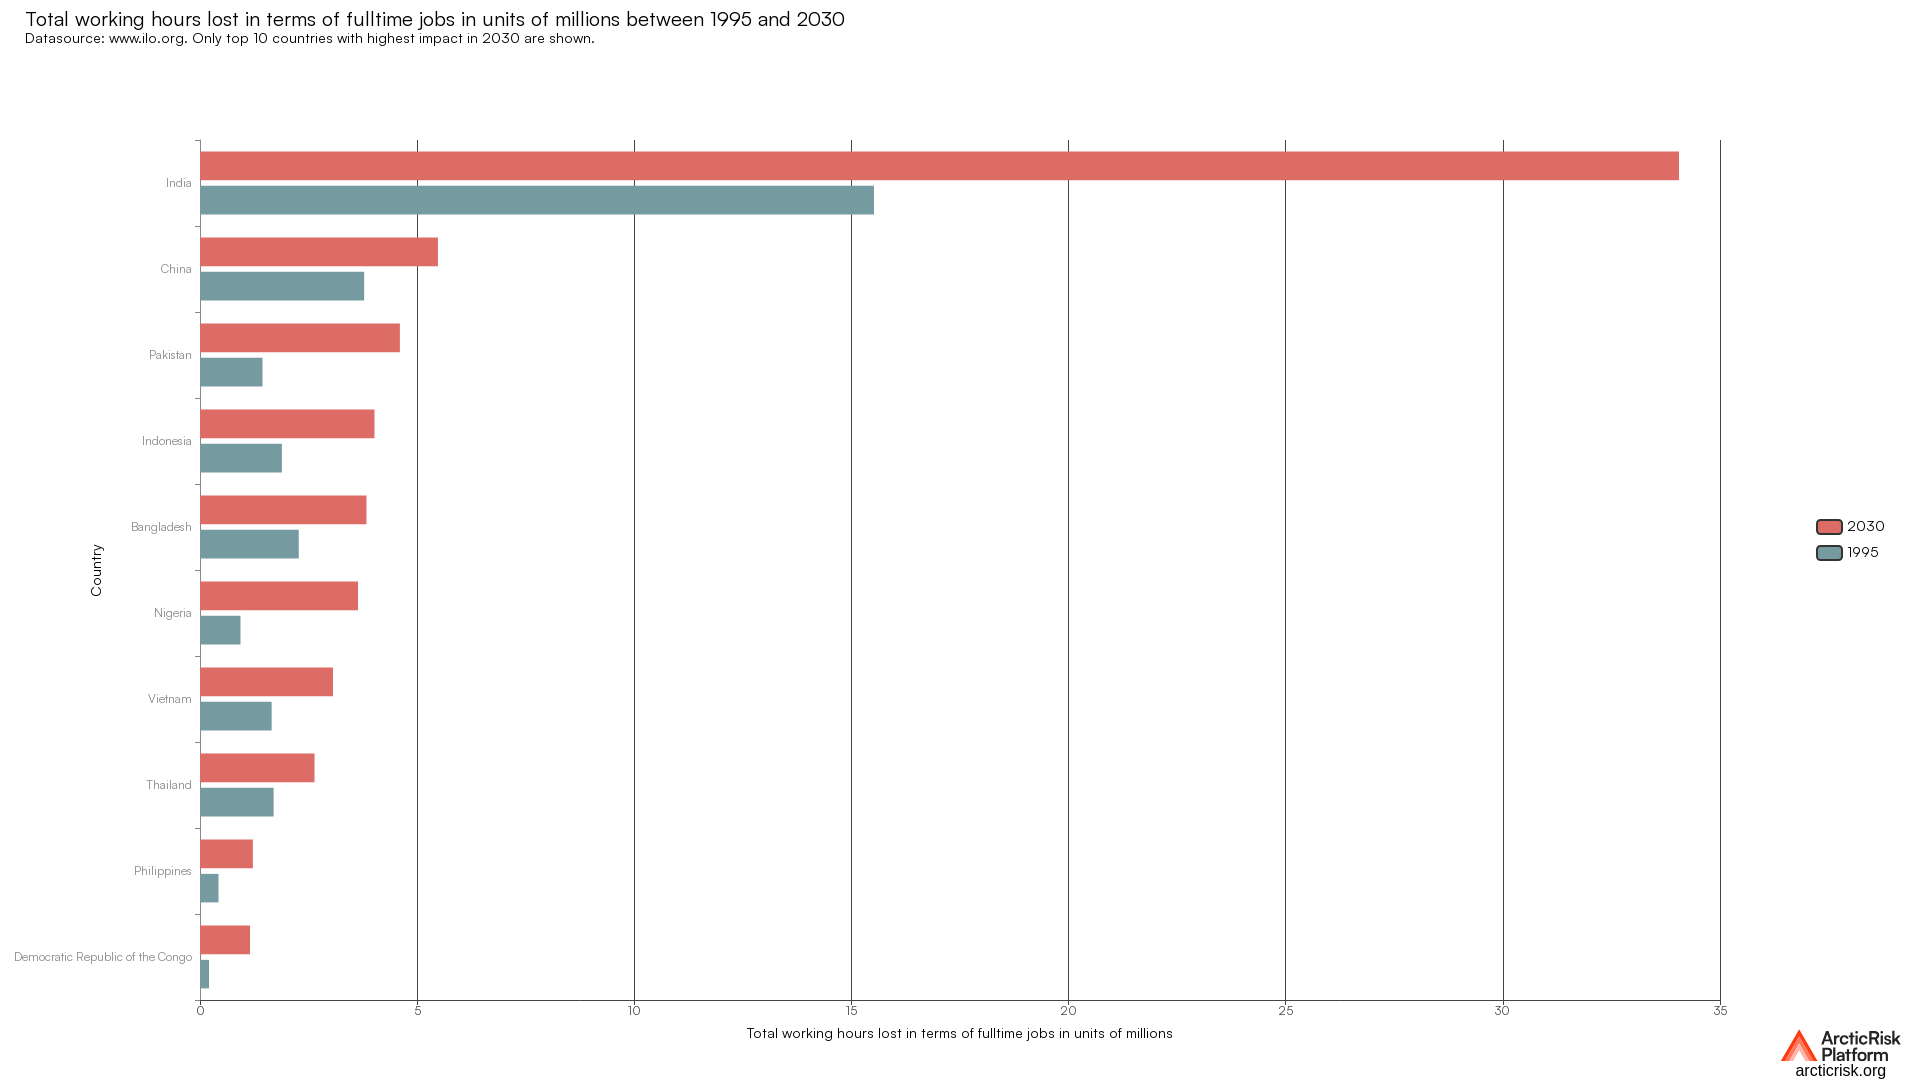
This dataset shwos the extent to which heat stress affects labour productivity, measured in terms of working hours, in virtually every cou…


This dataset shwos the extent to which heat stress affects labour productivity, measured in terms of working hours, in virtually every cou…
This dataset shwos the extent to which heat stress affects labour productivity, measured in terms of working hours, in virtually every cou…

This dataset shwos the extent to which heat stress affects labour productivity, measured in terms of working hours, in virtually every cou…


This dataset shwos the extent to which heat stress affects labour productivity, measured in terms of working hours, in virtually every cou…


This dataset shwos the extent to which heat stress affects labour productivity, measured in terms of working hours, in virtually every cou…


This dataset shwos the extent to which heat stress affects labour productivity, measured in terms of working hours, in virtually every cou…
This dataset shwos the extent to which heat stress affects labour productivity, measured in terms of working hours, in virtually every cou…


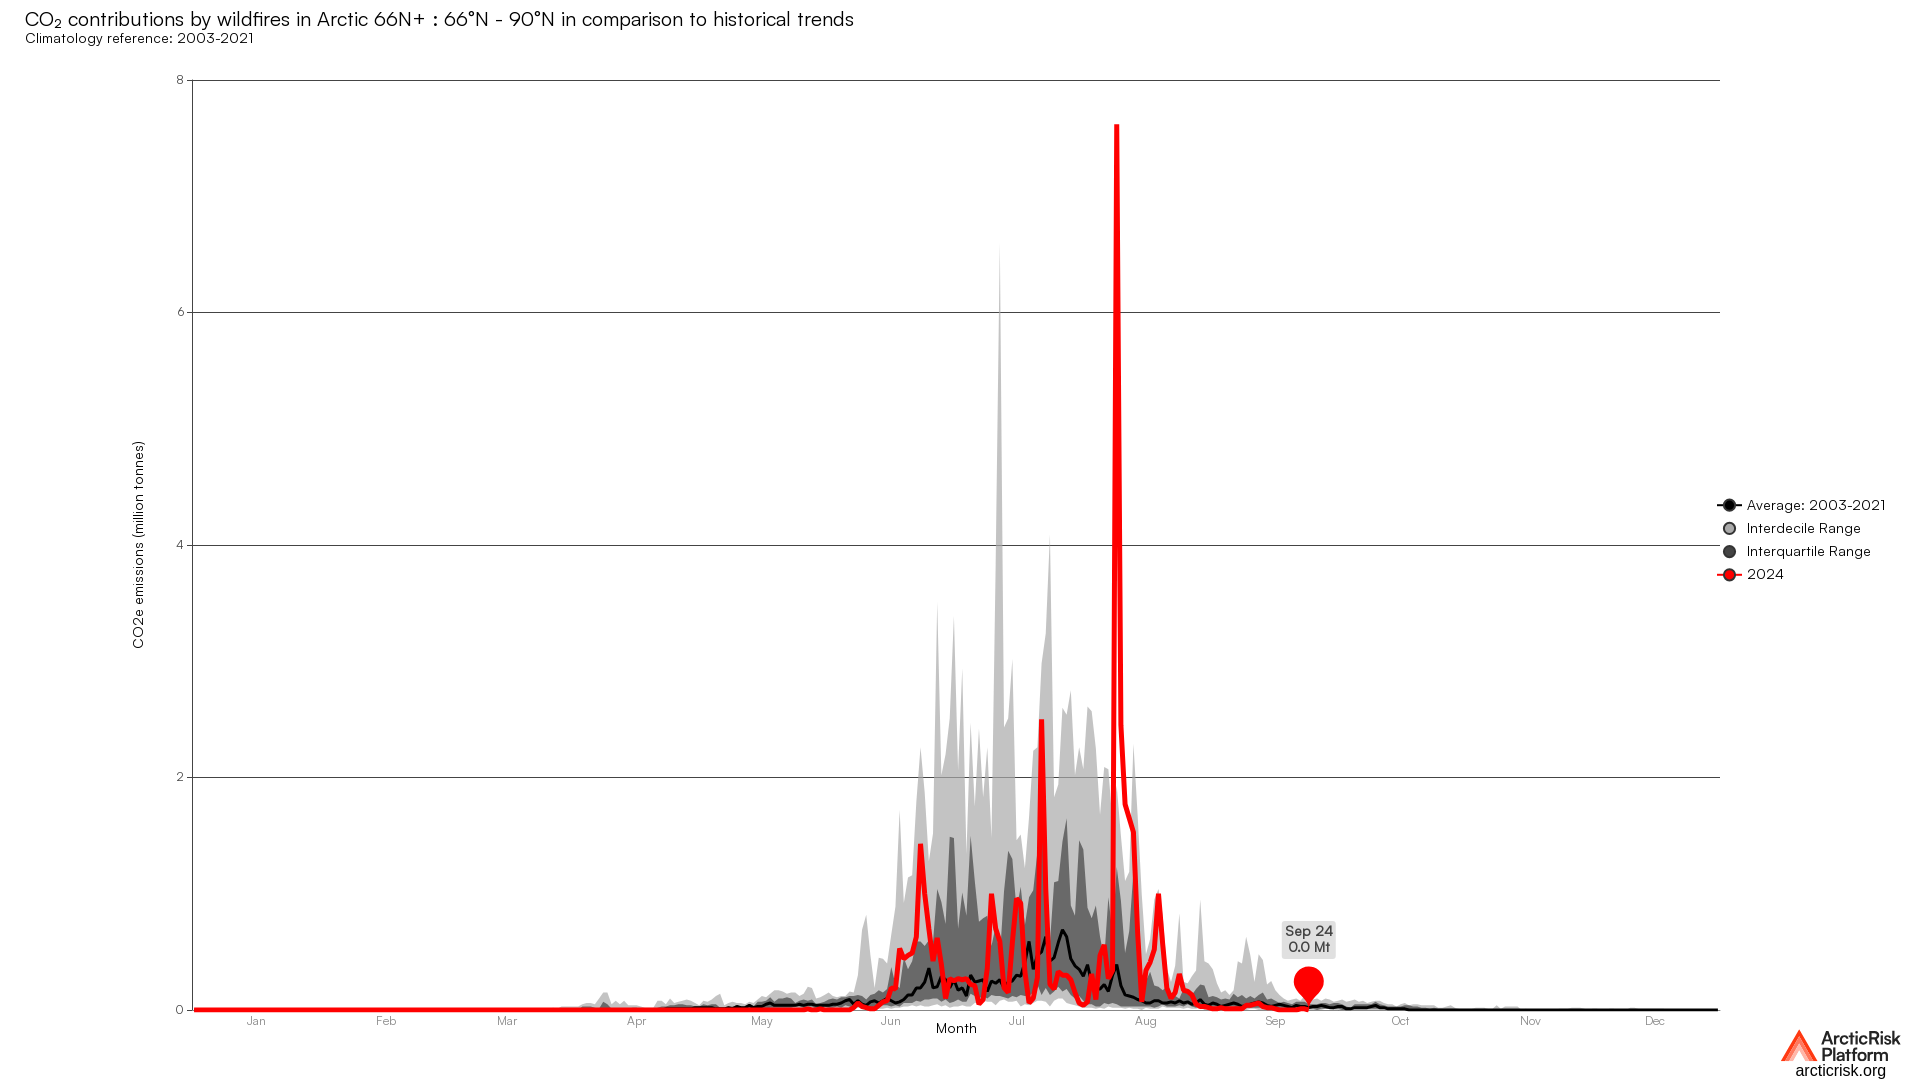
CO2 equivalent emissions in thousand tonnes caused by wild fires in different latitudnal regions . Dataset is based on Copernic…

CO2 equivalent emissions in thousand tonnes caused by wild fires in different latitudnal regions . Dataset is based on Copernic…


CO2 equivalent emissions in thousand tonnes caused by wild fires in different latitudnal regions . Dataset is based on Copernic…


CO2 equivalent emissions in thousand tonnes caused by wild fires in different latitudnal regions . Dataset is based on Copernic…