FREEZE: Climate Data Explorer


Daily Arctic Sea Ice extent in million km2 over the years.Derived from dataset made available by NSIDC; Dataset G02135.

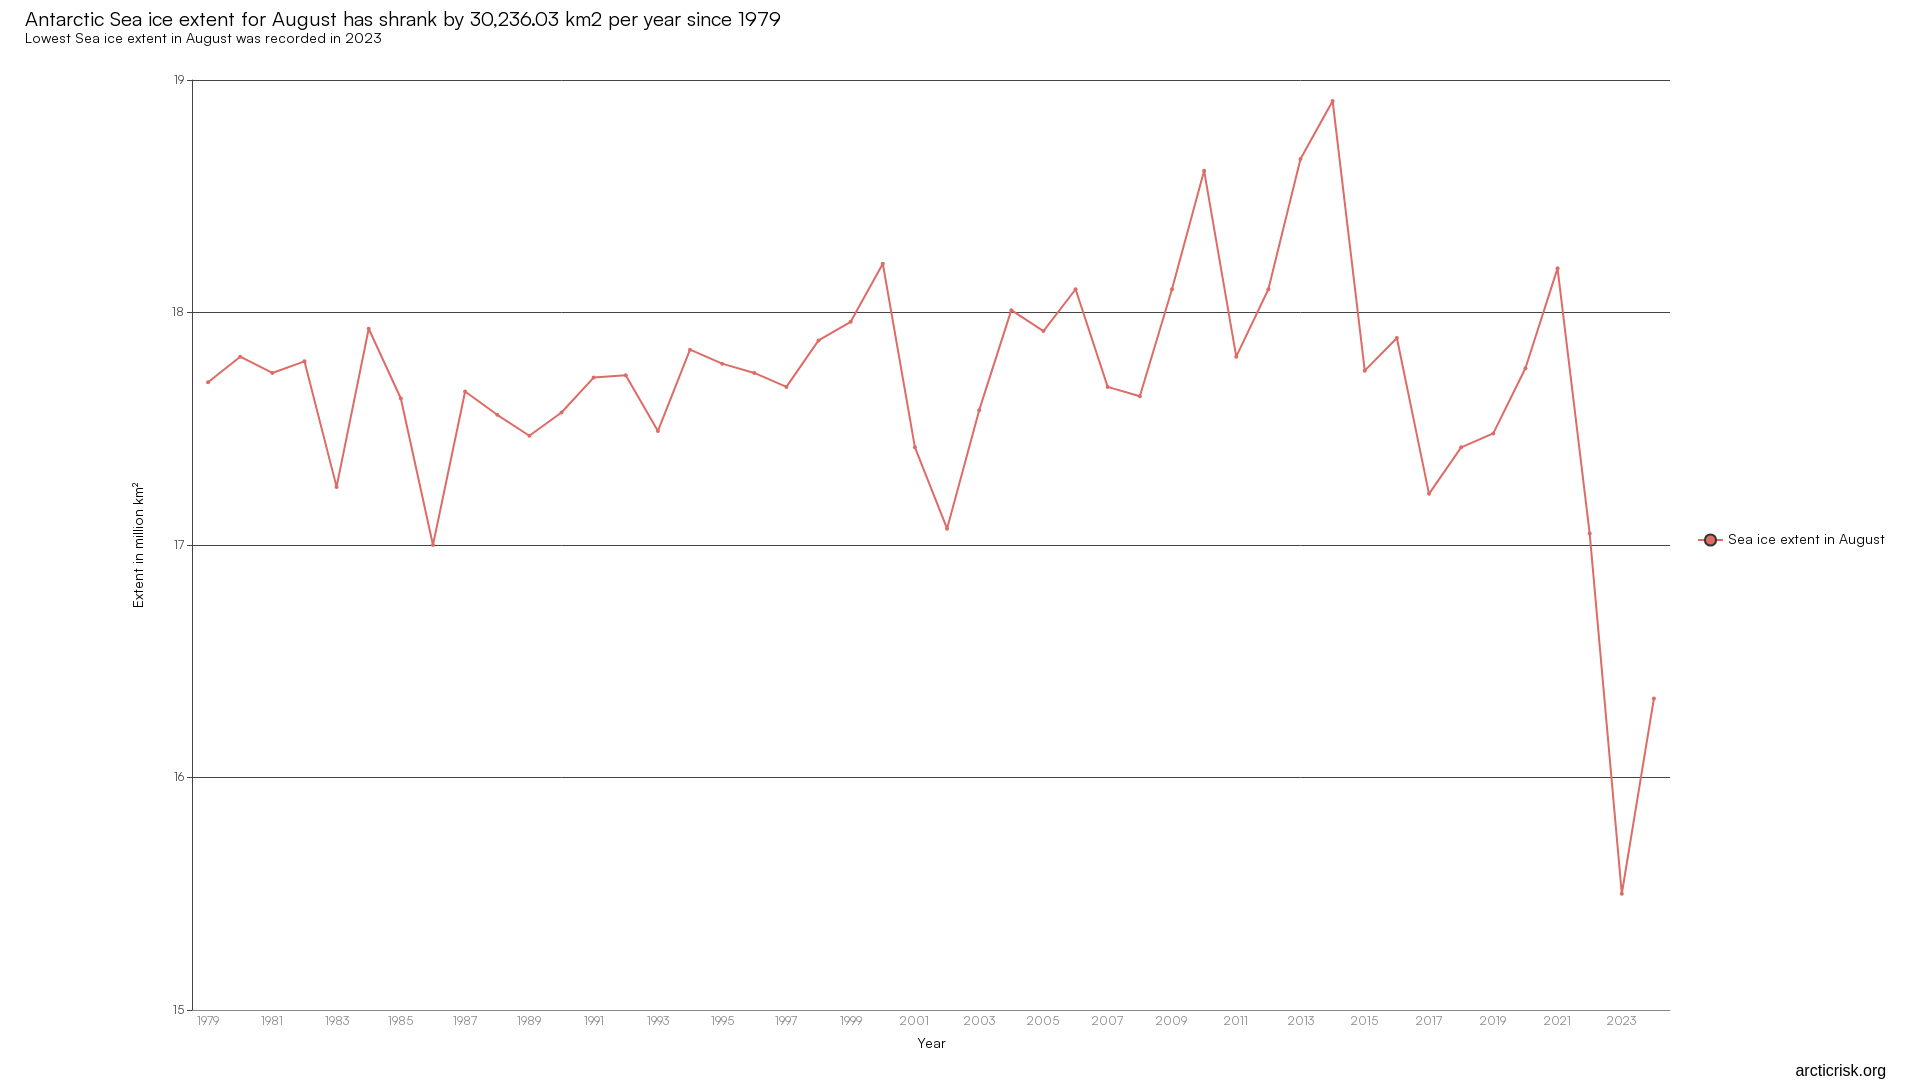
Daily Antarctic Ice sheet extent in million km2 over the years.Derived from dataset made available by NSIDC; Dataset G02135.


Daily Arctic Sea Ice extent in million km2 over the years.Derived from dataset made available by NSIDC; Dataset G02135.
Daily Arctic Sea Ice extent in million km2 over the years.Derived from dataset made available by NSIDC; Dataset G02135.

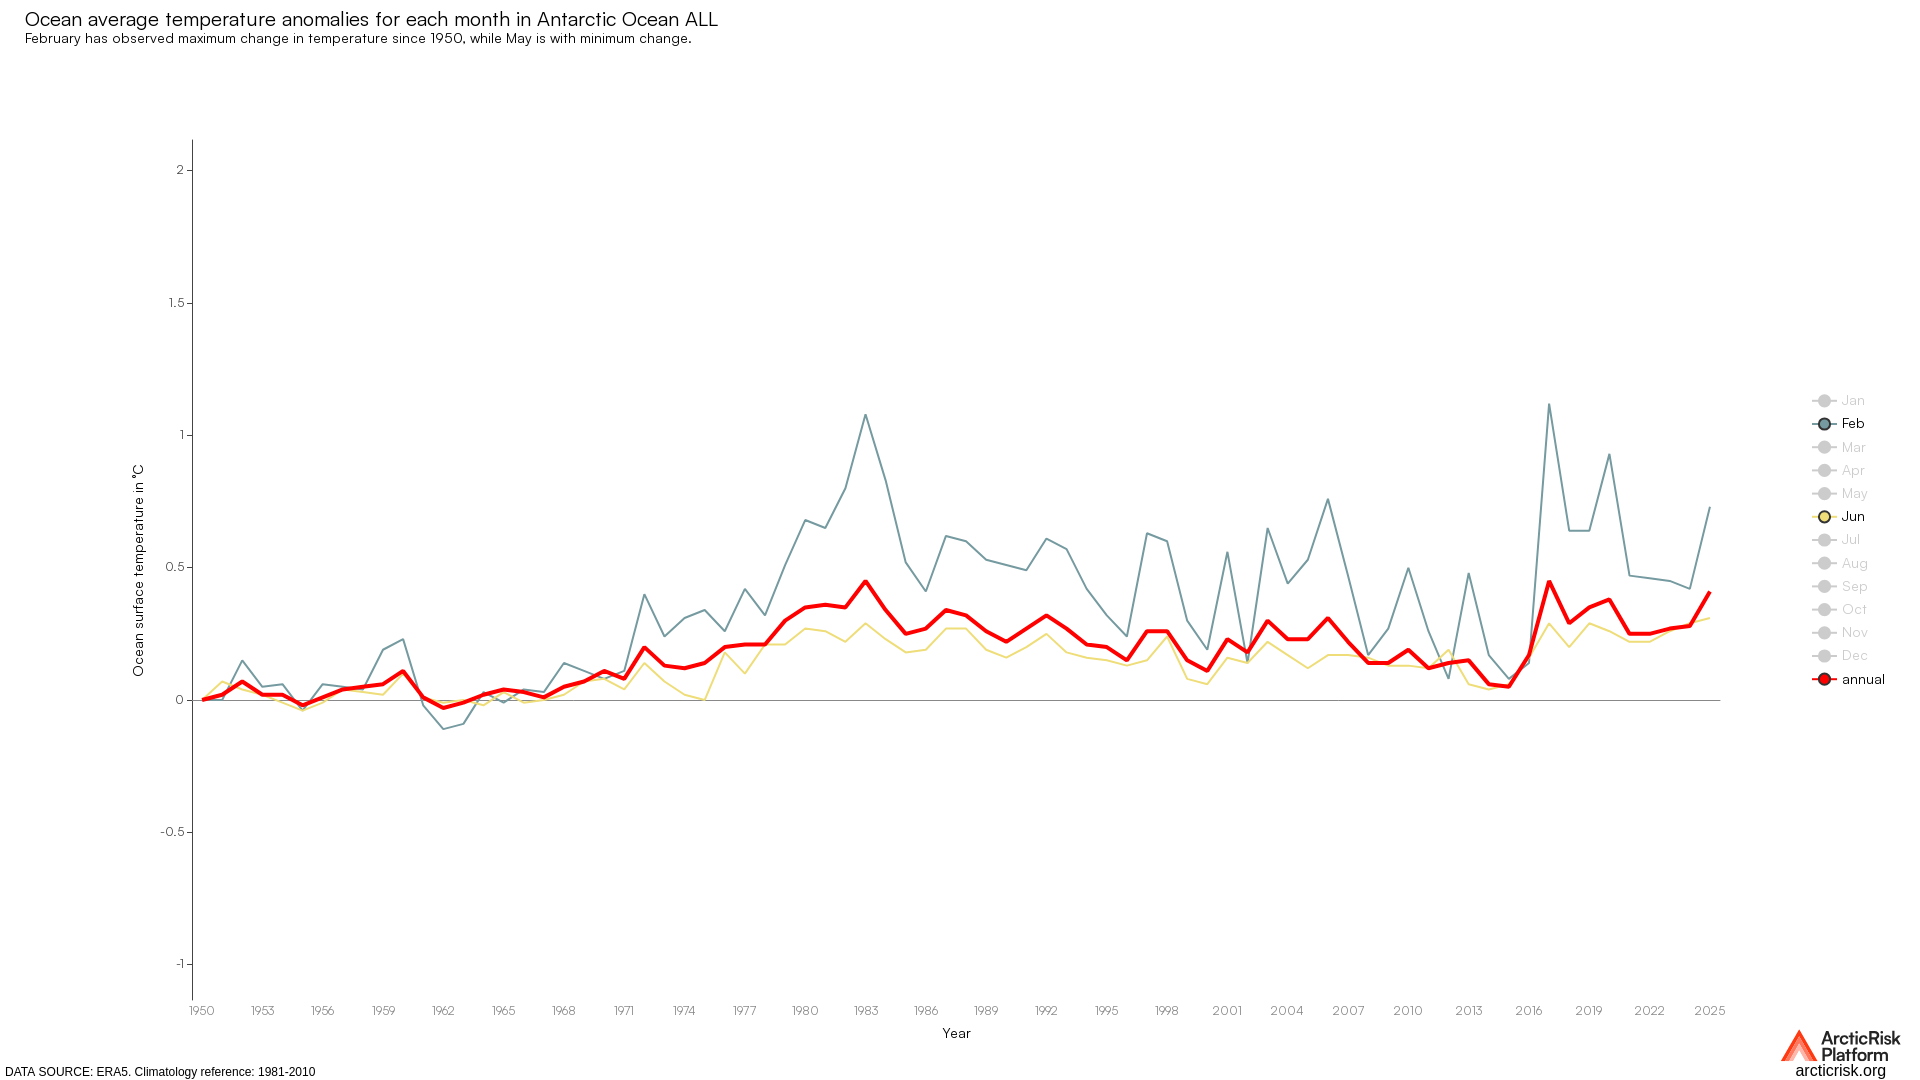
Daily of 2m surface temperature across various latitudnal zones over the years.Derived from dataset made available by ECMWF; Dataset :Daily…


Daily land only 2m surface temperature across various latitudnal zones over the years.Derived from dataset made available by ECMWF; Dataset…


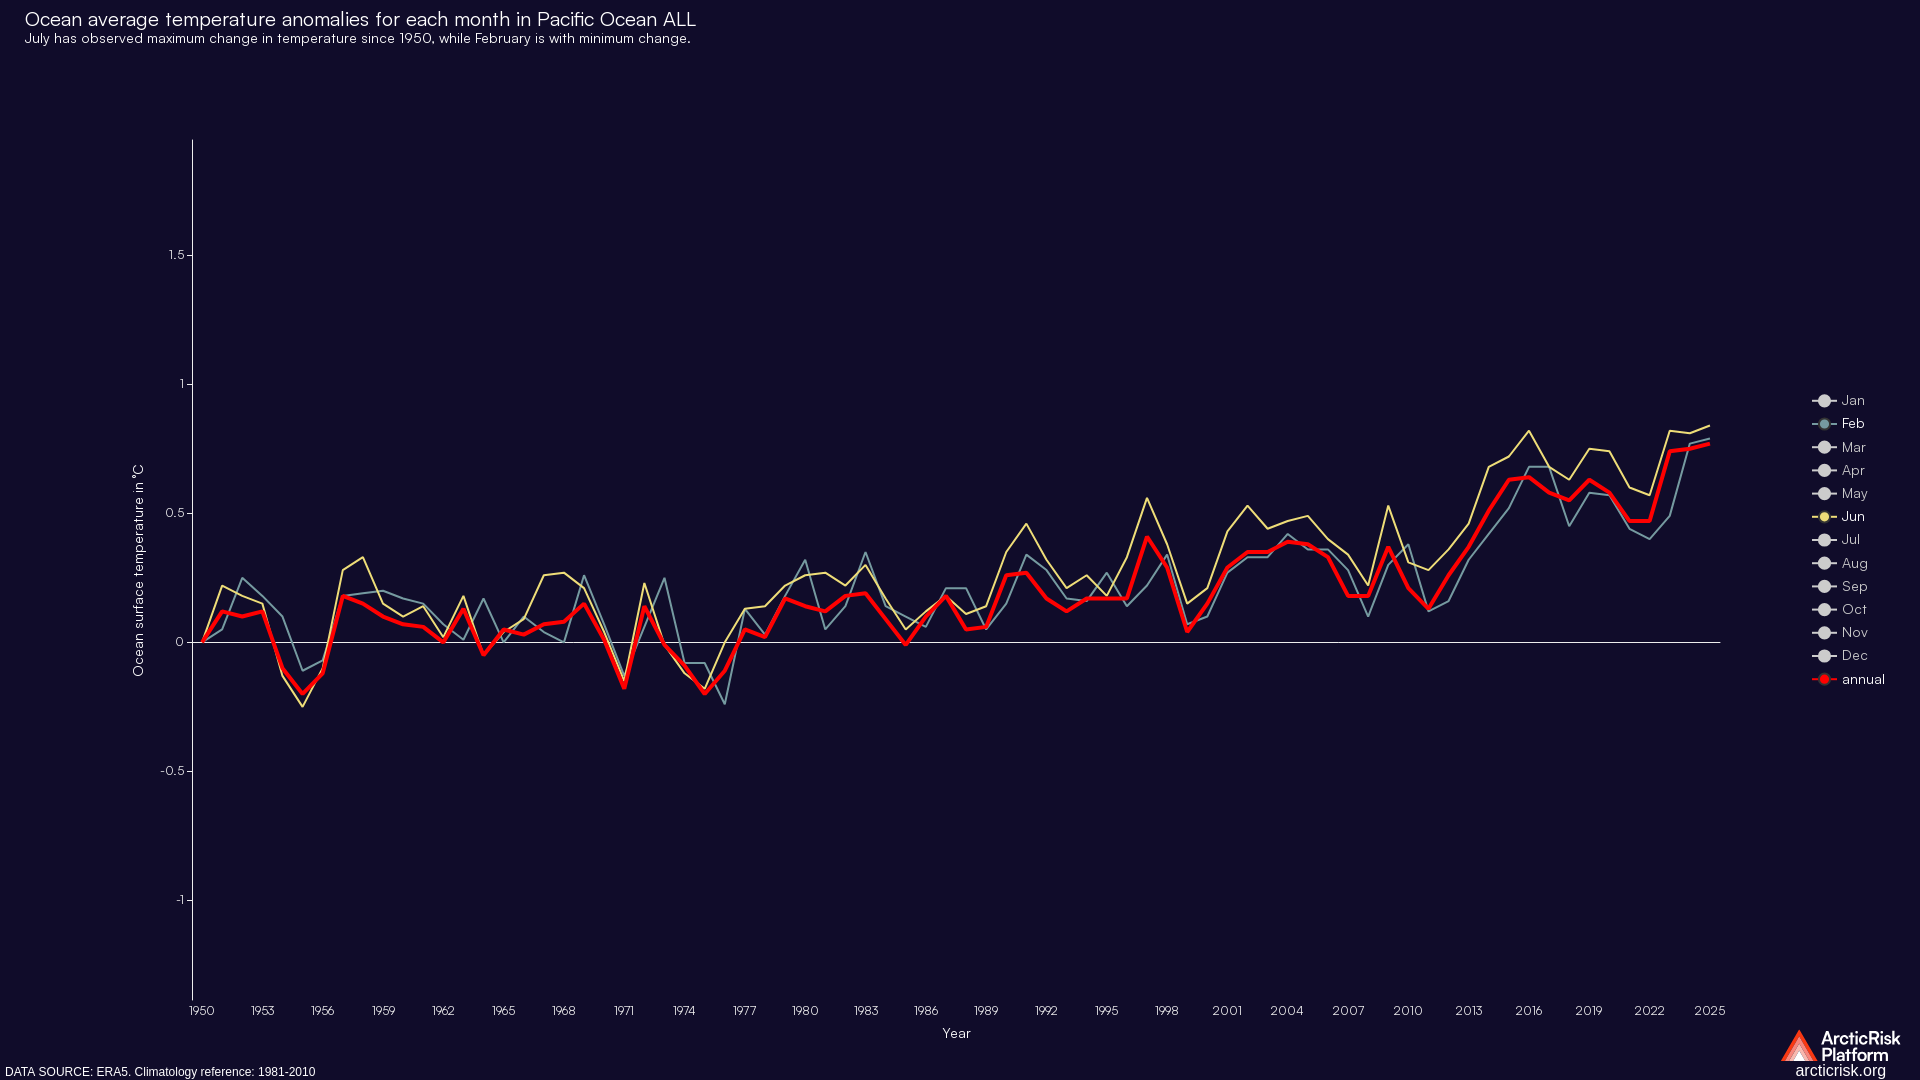
Daily of 2m surface temperature across various latitudnal zones over the years.Derived from dataset made available by ECMWF; Dataset :Daily…


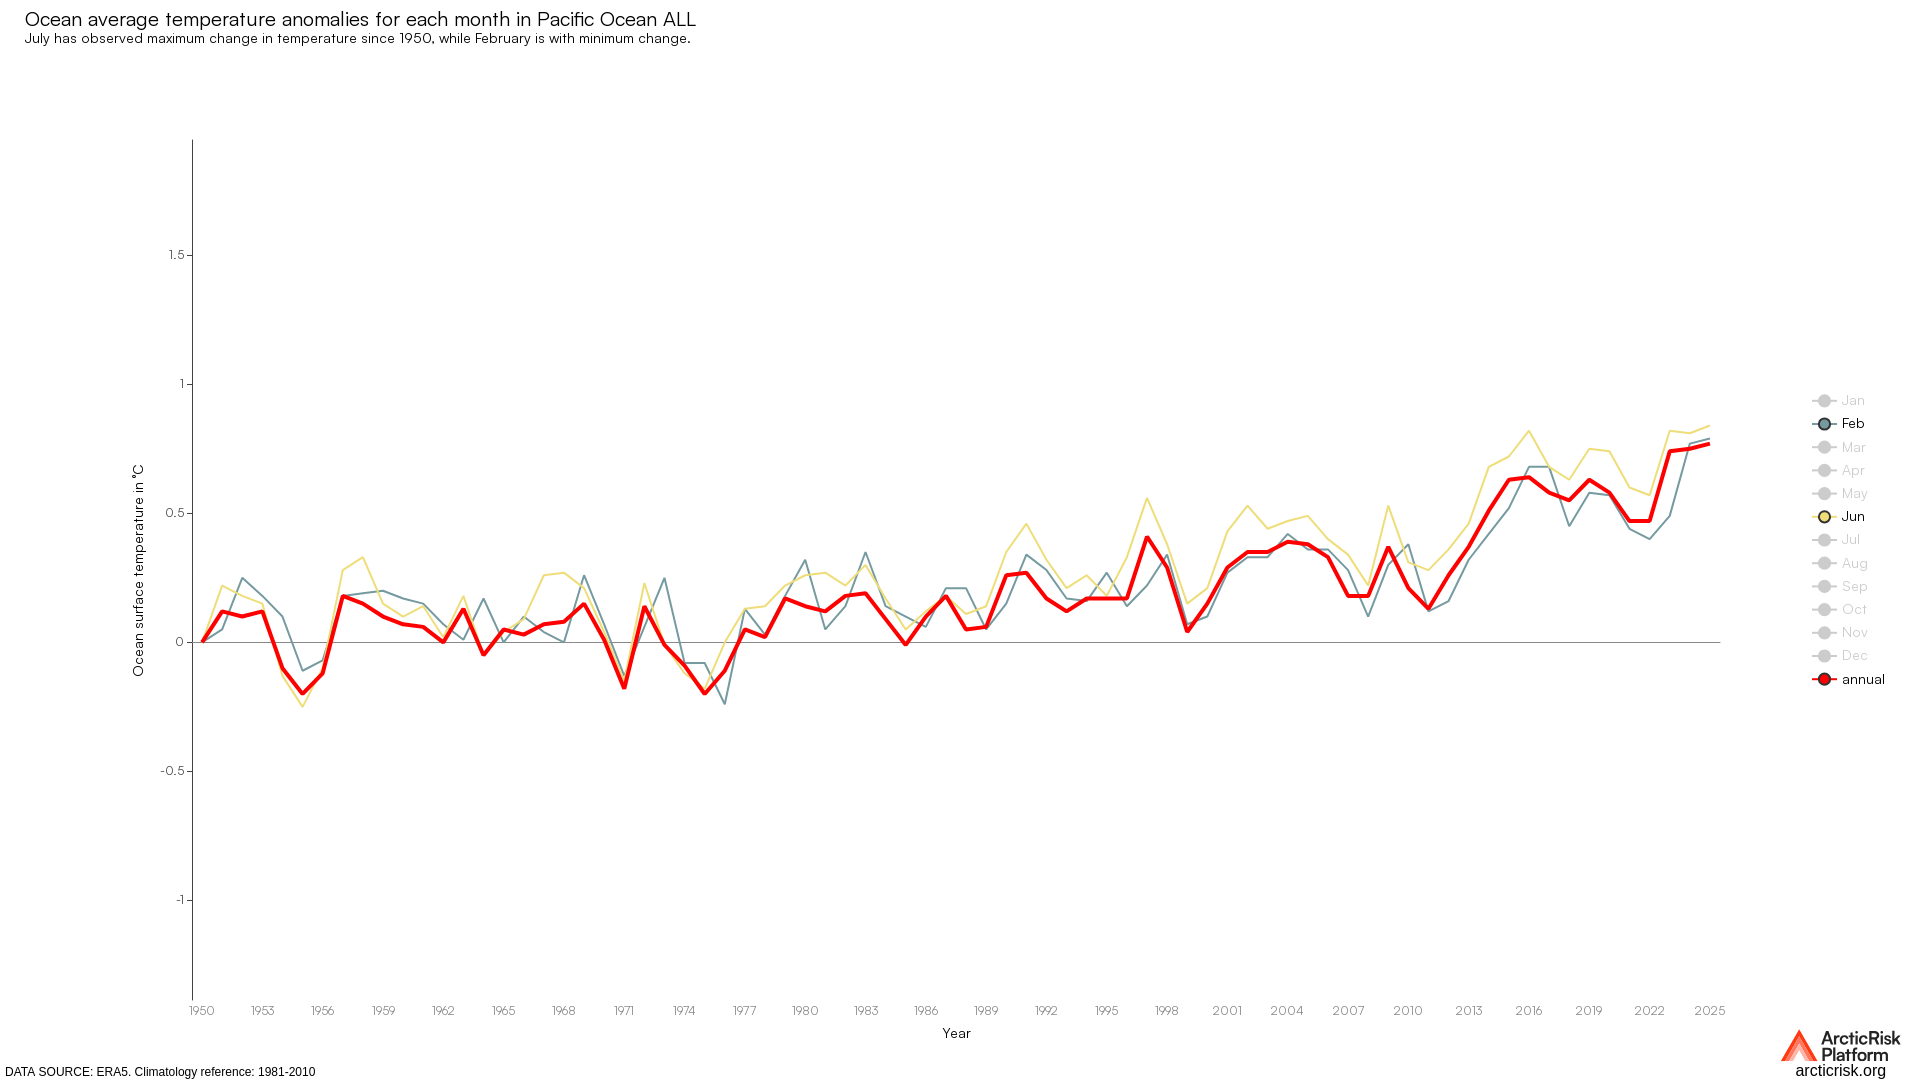
Daily of 2m surface temperature across various latitudnal zones over the years.Derived from dataset made available by ECMWF; Dataset :Daily…


Daily of 2m surface temperature across various latitudnal zones over the years.Derived from dataset made available by ECMWF; Dataset :Daily…


Daily of 2m surface temperature across various latitudnal zones over the years.Derived from dataset made available by ECMWF; Dataset :Daily…
Daily of 2m surface temperature across various latitudnal zones over the years.Derived from dataset made available by ECMWF; Dataset :Daily…


Daily of 2m surface temperature across various latitudnal zones over the years.Derived from dataset made available by ECMWF; Dataset :Daily…